If you were to book any single flight in the US, the chances of a plane crashing are essentially 0. However, the chances of a plane accident are slightly greater based on how the data classifications are set (see ‘plane crash vs. plane accident’).
Here are the chances of the plane crashing and your odds of dying in a plane crash, based on data from the Bureau of Transportation Statistics and National Transportation Safety Board between 2015 and 2020.
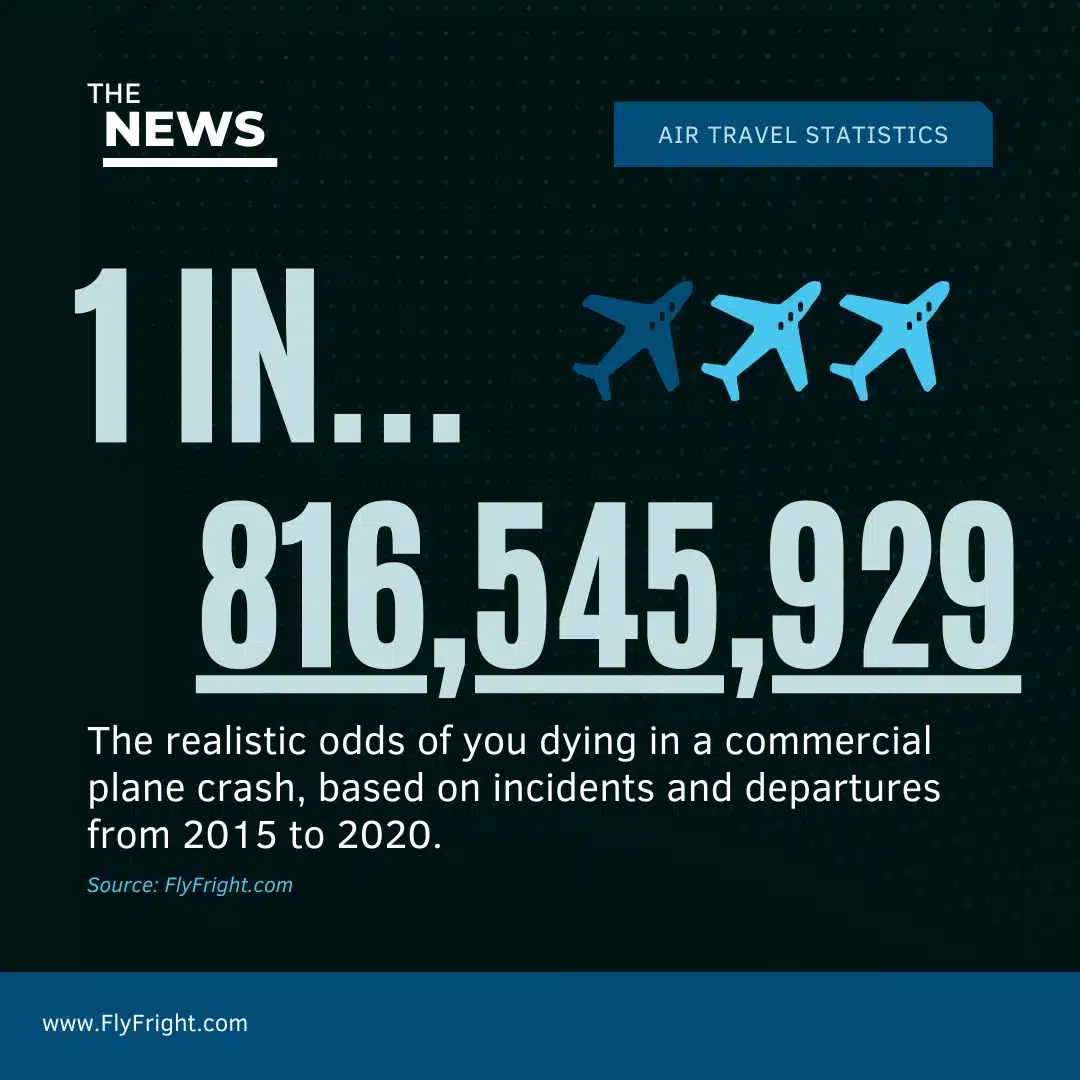
In short, the odds of a plane crashing are 0.000001% and you have a 1 in 816,545,929 chance of dying in a plane crash
To put this in perspective, your odds of winning the powerball jackpot are 1 in 292,200,000.
Don’t worry, if you’re a frequent flier, we’ll calculate your risk too. See ‘Risk over multiple flights’
Fast Facts – Analyzing Plane Accidents in the United States
- The chances of a large, commercial airplane carrier crashing is 0.000001%
- The odds of being involved in a commercial airplane accident are 1 in 260,256
- The odds of you dying in a plane crash are 1 in 816,545,929
- On-demand air taxis (ex. Private jets), had a total of 225 accidents, of which, 47 of those accidents resulted in at least 1 fatality.
- Between 2015 and 2019, general aviation, aka recreational pilots, averaged 0.88 fatalities per 100,000 flight hours. On demand air-taxis averaged just 0.23, and commuter airplanes averaged 0.21.
Based on statistics from 2015 to 2020, if you were to board any flight during the year, you’d have about a 1 in 260,256 chance of simply being in an accident (which includes any plane crashes), and you being unharmed, injured, or killed.
From that same data set you have about a 1 in 6,864,250 chance of being on a plane involved in an accident that results in at least 1 fatality.
But what are your odds of dying in a plane crash?
What is your specific chance of dying in a plane crash?
The chance of you, specifically, dying in a plane crash is about 1 in 816,545,929.
Risk, like many other things, is relative. By comparison to any other mass mode of transportation, airlines are by far the safest way to travel – and this is backed by statistics
By comparison, the risk of dying in a car accident in your lifetime is about 1 in 93, according to the National Safety Council.
Demystifying Risk Perception – 3 reasons air travel feels unsafe
Risk perception is an incredibly complex topic, well beyond the scope of this article. However, as risk perception relates to the safety of air travel, we break it down into 3 key points:
- Instantaneous vs. Chronic fallout
- Dreaded risk and outcomes
- Media exposure
- Personal control vs. lack of control over a situation
- Unfamiliar vs. familiar technology or environment
Instantaneous vs. Chronic fallout
People often have greater fears of singular, tragic, catastrophic risks, that may result in many casualties in the same place at the same time, than they do of risks that occur over a longer period of time and are dispersed amongst many people in many different places.
For example, many people are incredibly fearful of being in a plane crash, but not nearly as fearful of heart disease or lung cancer.
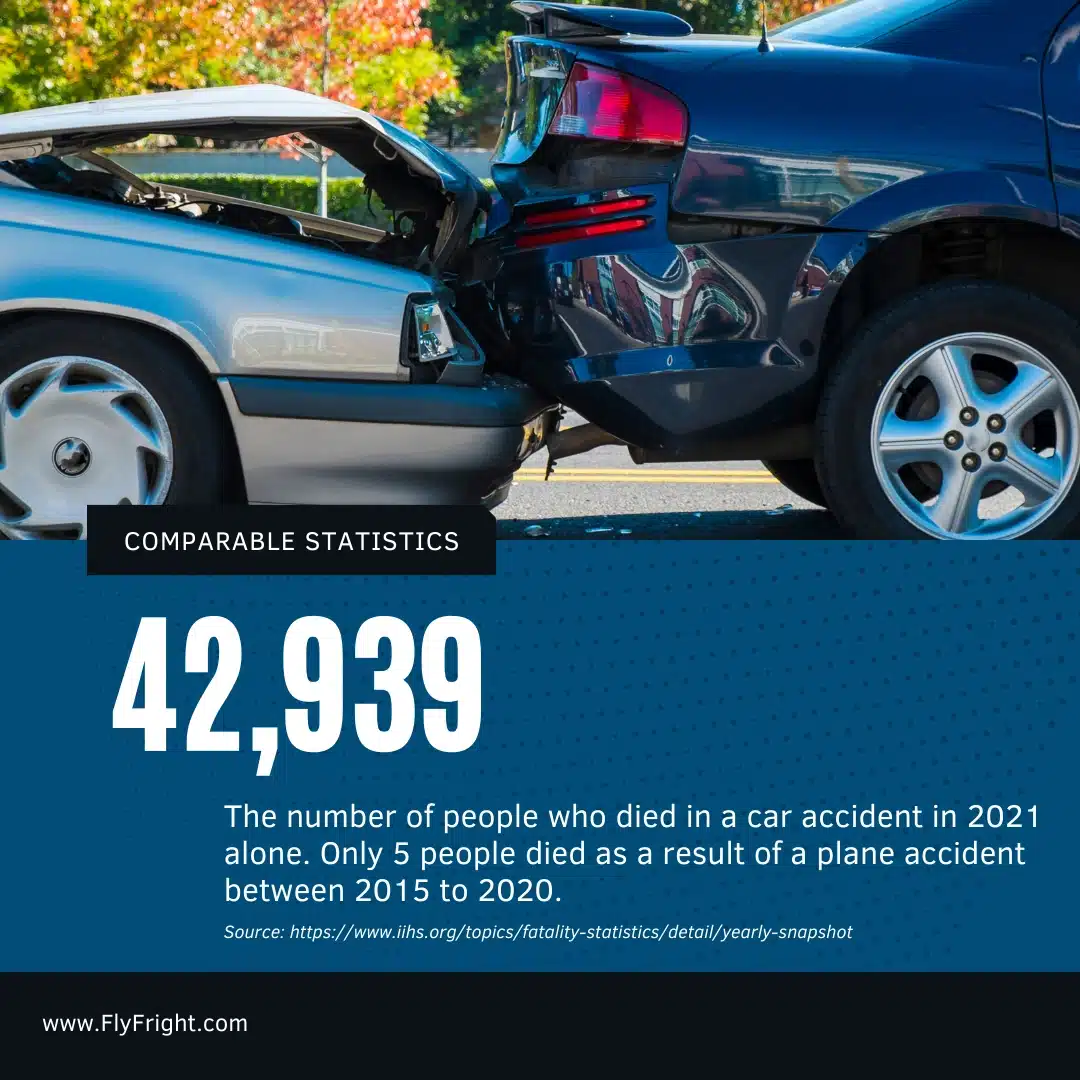
In the United States, there were 5 total casualties in commercial air carriers between 2015 to 2020. Each year about 697,000 people die from heart disease.In 2021, 42,939 died in motor vehicle crashes.
Any plane crash that results in 1 or more casualties is a topic that will take priority on the news cycle.
Why?
A few reasons – one, they’re incredibly rare. Two, they’re a spectacle to see, even if awful. Three, and most importantly, they’ll get people’s attention.
|
Attribute |
Instantaneous Fallout (ex. Plane Crash) |
Chronic Fallout (ex. Heart Disease) |
|---|---|---|
|
Nature of Event |
Acute, sudden catastrophic, no prior warning |
Gradual,develops over many years |
|
Impact |
Immediate and severe |
Slow and progressive |
|
Scope |
Localized to crash site and immediate surroundings |
Widespread and pervasive |
|
Response |
Rapid response often involving emergency services and crisis management teams |
Unhurried, not immediate, not an emergency. Gradual recommendations by healthcare professionals if monitored. |
|
Duration |
Less than a few weeks at most |
Ongoing and lifelong |
|
Public Perception |
Leads public to heightened sense of risk and fear, despite rarity |
Viewed as a common health issue that many people have. Less fear when everyone deals with it. |
Personal Control vs. Lack of Control
Those with aviophobia often say they’ll prefer driving over flying because they feel safer. This is usually related to the feeling of having control over their direction and outcomes, rather than being in the passenger’s seat and at the mercy of a pilot’s actions.
These anxieties and fears result from several additional factors, including:
- Lack of familiarity
- Invisibility of operations
- Gradual vs. sudden risk exposure
People who are in control of a situation have a lower perception of risk than those who do not have control. This fallacy results from the perceived ability to change the outcome of a situation, despite each available action resulting in the same outcome.
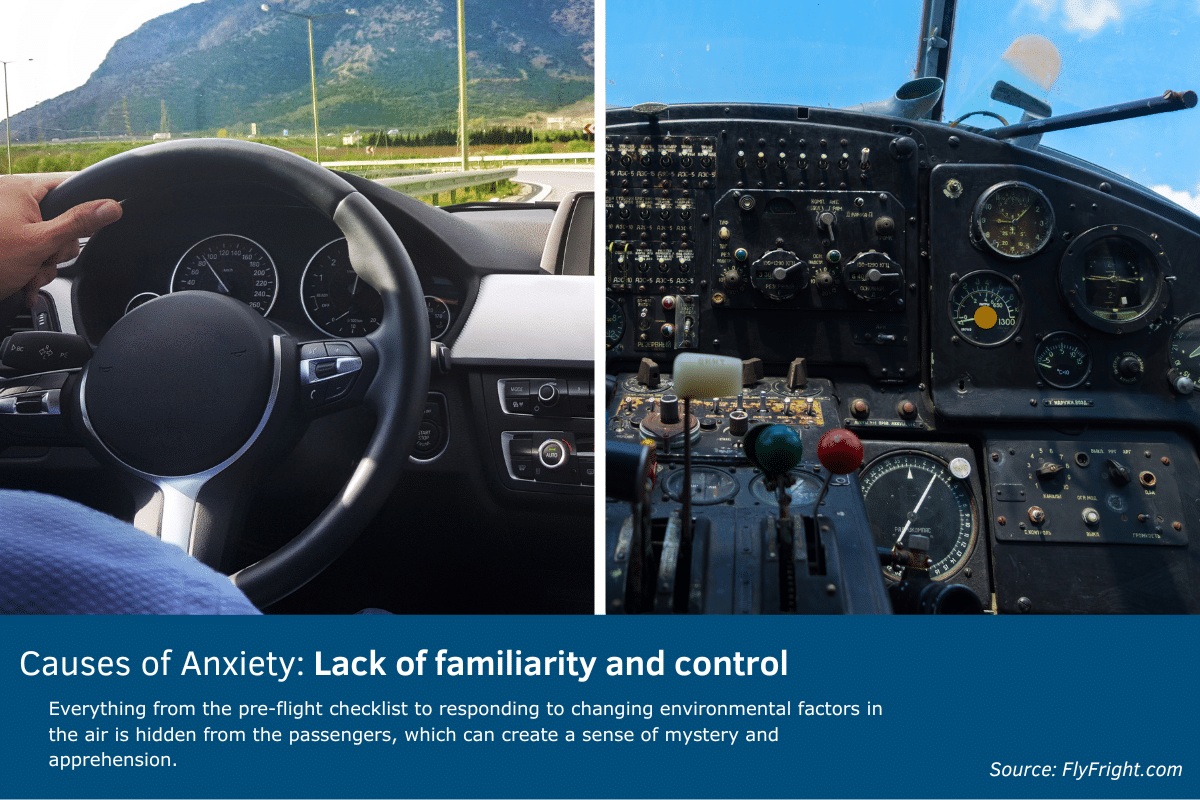
Unfamiliar vs. familiar technology and environments
Part of feeling safe is understanding how a vehicle, process, or really anything works. Most people are familiar with how a car works and drive one several days out of the week. This familiarity breeds comfort, in turn, reducing perceived risk.
Even for people who ride a bus or travel by subway, these modes of transportation are much simpler and easier to understand than air travel. Again, when these modes of transportation are used frequently, people become accustomed to them and not as fearful.
When it comes to air travel, the process is significantly more complex and less transparent to the average person. Everything from the pre-flight checklist to responding to changing environmental factors in the air is hidden from the passengers, which can create a sense of mystery and apprehension.
This is much more fear-inducing than seeing construction on the road or looking at the speedometer on your dash.
Risk over multiple flights
The question we’re looking to answer here is, “Does flying more often increase my chances of being in a plane crash?”
The short answer is, yes it does, but not by much.
If you’re a frequent flier, that does not technically mean that on your next flight you have an increased risk of being in an accident or dying in an air travel accident.
Just because you have flown once or even several times before (and have been in an accident or not), does not increase your risk of being in one on your next flight.
The risk of being in a crash or accident is the same regardless of whether you’ve flown once or a hundred times.
But why is that?
The simple answer is that each flight you take is mutually exclusive from the next one and your last one. The flight you took yesterday does not influence the flight you take today.
Let’s look at a more simple example – a coin flip.
If you flip a coin and it lands on heads, what’s the probability that it will land on heads a second time?
If you said 50/50, you’d be correct.
However, we’re interested in every single one of our coin flips resulting in heads. Or in other words, every flight landing safely and without issue.
This is an entirely different question entirely.
What are the odds of a coin flip being heads 3 times in row?
⅛, since ½ * ½ * ½ = ⅛
Using this logic, we apply it to the questions below.
The question we’re looking to answer now is, “If I fly ‘x’ times a year, what’s my risk of dying in an air travel accident?” Where ‘x’ is the number of times you fly in a year.
What we’re differentiating here is the number of trials we’re looking at. Put more simply, these 3 different scenarios:
- Chance of dying on your first, or next, flight.
- Chance dying within the next ‘x’ flights.
- Dying at any point within your lifetime on a flight.
If you were to board any flight during the year, you’d have a 1 in 292,398 chance of being on an aircraft involved in an accident, regardless of whether you are unharmed, injured, or killed.
Scenario 1 – Chances of dying on your first, or next, flight
As was stated earlier, you have a 1 in 816,545,929 chance of dying in a plane crash, or in other words, a 816,545,928 in 816,545,929 chance of not dying in a plane crash, aka the desired outcome.
Scenario 2 – Chances of dying within the next ‘x’ flights
‘X’ is the number of trials or flights you’d want to look at. Assume you’re going to fly 4 times over the next year and you want to know what your chances of being injured or dying are.
Since your chance of dying is 1 in 816,545,929, we know that your chance of not dying is 816,545,928.
Thus, we will take (The odds of NOT dying in a plane crash / The total population)^x.
So, (816,545,928 / 816,545,929)^4 = 99.999999510% of not dying in your next 4 flights.
In other words, you have a 1 in 204,136,489 chance of dying within those next 4 flights.
Scenario 3 – Dying at any point within your lifetime on a flight
To calculate this, we would need to know the number of times you’ll fly within your lifetime.
So unless you book your flights out really, really far in advance, we don’t have a known number of trials to work with. Thus, we’ll make a few estimations.
In this case, it’s better to take a few situational examples. Odds are, you fall into one of the below categories.
- You have never flown before (# of flights < 1)
- You fly less than a few times a year, likely to see family, or for a short vacation (# of flights < 10)
- You fly frequently, likely for work (# of flights > 9)
For those that have never flown before, we’ll assume you’ll rarely travel in the future, maybe a few more times in your life. Let’s say 6, so 3 more round trips. You have a 99.99999927% chance of never dying in a plane crash.
For the infrequent flier, you may fly maybe 60 more times in your life, 30 more round trips. You have a 99.9999265% chance of never dying in a plane crash.
For the frequent work traveler, let’s assume you’ll fly 200 more times in your life, 100 more round trips. You have a 99.99997551% chance of never dying in a plane crash.
Plane Crash vs. Plane Accident – What’s the difference?
- There is no universally recognized definition for a “plane crash”
- An occurrence that results in a fatal or serious injury to a person, substantial damage to the aircraft, or the aircraft goes missing or becomes inaccessible, can be classified as an ‘incident’ or ‘accident’.
- A plane crash, in the general sense of the term, can be classified as a plane accident.
For most people, a ‘plane crash’ is an airplane descending from the sky into the ocean or wilderness. The plane hits the surface and bursts into flames.
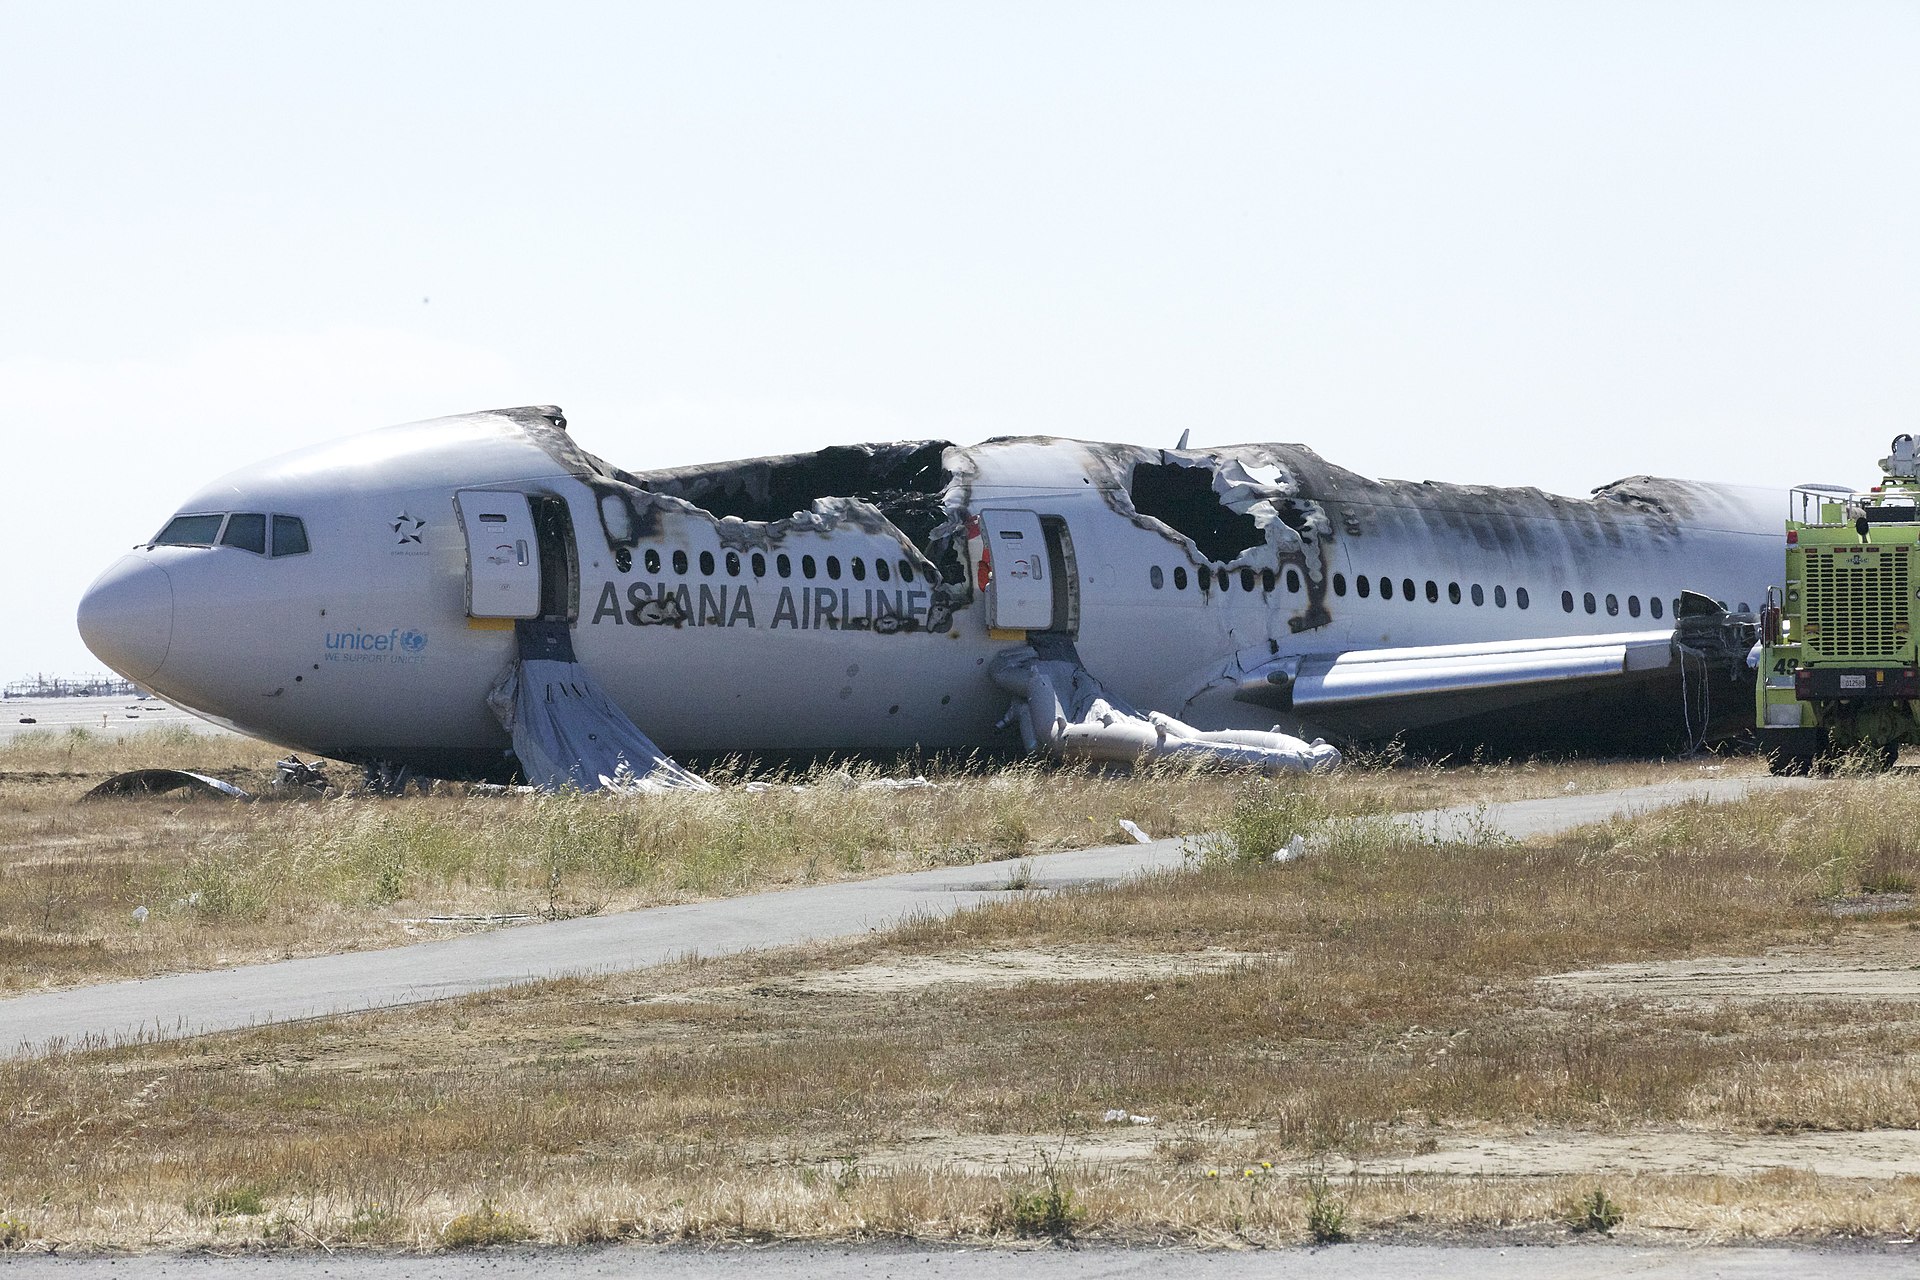
Asiana Airlines Flight 214 after it crash landed at San Francisco International Airport on July 6th, 2013. The crash was a result of pilot error and pilot fatigue. 3 passengers suffered fatal injuries. Source: NTSB via https://www.flickr.com/photos/ntsb/9237803015/
Unfortunately, a better definition is needed and that’s why the National Transportation Safety Board specifies something different entirely.
“Accidents” and “incidents,” are the terms the NTSB uses, both of which are further grouped under “occurrences”
Per the NTSB, “Generally, accidents and incidents differ only in the degree of injury sustained by persons involved or in damage sustained to the aircraft. Each category has a unique name and identifier to permit common coding in accident/incident systems, a text definition, and usage notes to clarify the category and aid in coding occurrences.”
https://www.ntsb.gov/safety/data/Documents/datafiles/OccurrenceCategoryDefinitions.pdf
Accident vs. Incident – General categorizations
Accident
- Typically involves significant damage to the aircraft and/or injury to the passengers or crew or a fatality.
- Substantial damage to the aircraft
- Substantial injury or harm to the occupants (passengers and crew)
- Substantial harm or damage to the people on the ground
- Ex.
Incident
- Less severe, usually doesn’t result in significant damage or serious injury.
- Minor or no damage to the aircraft
- Minor or no harm to the occupants (passengers and crew)
- Minor or no harm to the people on the ground.
For example, American Eagle Flight 4125, was considered an accident by the NTSB. We can speculate that it would be reasonable for those aboard the flight to say, “the plane crashed off the runaway.” While this is true, this example illustrates how varying definitions can skew one’s perception of the occurrence. In reality, the plane landed, but then slid off the runway with one of the wings tipping and digging into the ground. No one was killed or injured in the event.
See the math
|
Fact: |
The chances of a large, commercial airplane carrier crashing is essentially 0. |
|---|---|
|
Data Source: |
# of US Air Carrier Accidents – Bureau of Transportation Statistics |
|
Time period of all data: |
January 1, 2010 to December 31, 2020 |
|
Total departures: |
98,610,240 |
|
Total Accidents: |
319 |
|
Total accidents resulting in at least 1 fatality: |
2 |
|
Equation: |
1 Crash / 98,610,240 Departures = 0.000001% |
|
Comments: |
Asiana Airlines Flight 214 is the only accident that would generally be considered a “crash.” In the downward descent to land, the plane struck the seawall. |
|
Fact: |
1 in 816,545,929 chance of you specifically, dying in a plane crash |
|---|---|
|
Data Source: |
# of Passengers – Bureau of Transportation Statistics # of Fatalities – Bureau of Transportation Statistics |
|
Time period of all data: |
January 1, 2015 to December 31, 2020 |
|
Total Passengers (US Air Carriers): |
4,082,729,647 |
|
Total Fatalities: |
5 |
|
Equation: |
5 total fatalities / 4,082,729,647 = 0.0000001225% or a 1 in every 816,545,929 passengers. |
|
Comments: |
The 16 fatalities classified under ‘Commuter Carrier’ were removed from this calculation. This is for two reasons. For one, the overwhelming majority of these fatalities occurred in rural parts of Alaska on smaller Cessna aircraft that, while technically are ‘Commuter Carriers’, are not the typical aircraft the majority of travelers will be on in the United States. Secondly, upon querying of NTSB data, 3 of these fatalities are not accounted for. NTSB #’s included in this analysis are: ANC15FA049, ANC16FA061, ANC17MA001, DCA18MA142, ANC19FA019, DCA20MA002, ANC20FA017. Upon review of the number of annual passengers, there is not a clear distinction as to what categories of aircraft are included in the summations. This analysis assumes it includes Major U.S. Air Carriers and Commuter Carriers. |
|
Fact: |
1 in 260,256 chance of simply being involved in an accident (which includes any plane crashes), unharmed, injured, or killed. |
|---|---|
|
Data Source: |
# of Air Carrier Departures – Bureau of Transportation Statistics # of Commuter Carrier Departures – Bureau of Transportation Statistics # of Air Carrier Accidents – Bureau of Transportation Statistics # of Commuter Carrier Accidents – Bureau of Transportation Statistics |
|
Time period of all data: |
January 1, 2015 to December 31, 2020 |
|
Total departures: |
54,914,000 |
|
Total accidents: |
211 |
|
Equation: |
211 departures / 54,914,000 = 0.000384% or 1 in every 260,259 |
|
Comments: |
I was able to cross-reference and verify 184 of these accidents for the same period in the NTSB’s public database. It is not clear if the BTS counts an accident involving two planes (ex. Bumping into one another on the runway) as a single accident or two accidents. It appears that the NTSB counts this as a single accident, which may account for some of the discrepancy. Using the CAROL database on the NTSB, here’s the filter: Event Date: Between 1/1/2015 to 12/31/2020Country: USAAircraft Category: AirplaneScheduled: ScheduledEvent Type: AccidentPurpose of Flight: NOT Personal. |
|
Fact: |
1 in 6,864,250 chance of being on a plane involved in an accident that results in at least 1 fatality. |
|---|---|
|
Data Source: |
# of Air Carrier Departures – Bureau of Transportation Statistics # of Commuter Carrier Departures – Bureau of Transportation Statistics # of Air Carrier Accidents Resulting in at least 1 fatality – Bureau of Transportation Statistics # of Commuter Carrier Accidents Resulting in at least 1 fatality – Bureau of Transportation Statistics |
|
Time period of all data: |
January 1, 2015 to December 31, 2020 |
|
Total departures: |
54,914,000 |
|
Total accidents resulting in at least 1 fatality: |
8 |
|
Equation: |
8 accidents with at least 1 fatality / 54,914,000 = 0.000015% or 1 in every 6,864,250 |
|
Comments: |
I was able to cross-reference and verify the 8 accidents that resulted in at least 1 fatality for the same period in the NTSB’s public database. Using the CAROL database on the NTSB, here’s the filter: Event Date: Between 1/1/2015 to 12/31/2020 Country: USA Aircraft Category: Airplane Scheduled: Scheduled Event Type: Accident Purpose of Flight: NOT Personal. The NTSB numbers are: ANC20FA017 DCA20MA002 ANC19FA019 DCA18MA142 ERA17FA172 ANC17MA001 ANC16FA061 ANC15FA049 |
Other statistical takeaways from government data and FAQ’s
How safe are airplanes from crashing?
Generally, air travel is very safe, especially when compared to other modes of transportation.
For every 1,000,000 miles you travel in a car, statistically, you can expect to be in about 4.5 crashes. For every 100,000 flights you take on a US Carrier (i.e. Delta, United, American, etc.), statistically, you can expect to be involved in about 1.05 accidents.
Luckily, with agencies like the Federal Aviation Administration and the Bureau of Transportation Statistics, there is plenty of reliable data that gives us an insight into how we get from Point A to Point B, with some that go as far back as 1960.
What makes a flight ‘safe’? Given the data the BTS provides, someone could loosely categorize a safe flight as one that:
- Does not result in any fatalities
- Does not result in any injuries
Our definition of ‘safe’ somewhat aligns with the FAA definition of an ‘Aircraft Accident.’ The only difference is that the FAA will count an event as an accident if the aircraft receives substantial damage, despite no one being injured and killed.
For example, a pilot overshoots the runway because of bad weather conditions. The plane lands, and no one on board is injured or killed, although the plane is significantly damaged. This would be counted as an accident.
From 2015 to 2020, between passenger cars and trucks (light + large), there were 62,101,894 total crashes and 14,533,165 total injuries. For the same time period, commercial US air carriers had a total of 176 total accidents and 111 total injuries.
It is extremely rare for a plane to crash, which is precisely the reason why we feel as if we often see it in the news. Out of the estimated 8.5M departures that occur annually (2015 to 2020 average), roughly 42.5M cumulatively over that time period, there were only 176 total accidents – a 0.000414% accident per departure rate.
Unfortunately, the BTS does not provide an estimated “annual departure,” number for passenger cars or trucks. It’d be nearly impossible to collect data on that. We cannot make an ‘apples to apples’ comparison for this.
The closest comparison we can make is by looking at the average number of crashes for cars and trucks combined, which, from 2015 to 2020, on average was, 451.89 per 100,000,000 vehicle miles, or 4.5 crashes per 1,000,000 miles.
Assuming you drive the standard 15,000 miles per year starting at age 16, it’ll take you approximately 67 years to drive 1,000,000 miles. Between the age of 16 and 83, you are statistically expected to be in about 4.5 crashes. Compared to 1.05 accidents for every 100,000 flights, you’d need to be on a flight every week for the next 1,923 years before being involved in an accident.
However, we never hear about the accidents in cars or trucks because they’re so common and rarely make for a sensational headline.
How safe is flying on a plane?
Flying on a US Air Carrier is extremely safe. For ease of reading, ‘US Air Carrier’ will be used interchangeably with ‘large commercial airplane’.’
You would need to board and depart on approximately 294,000 flights before you’re even involved in a single accident. To ever be seriously injured on a large commercial airplane, you would need to depart on approximately 476,000 flights. The risk of being killed is even lower. You would need to depart on close to 10,000,000 flights before becoming a fatality.
To further put that in perspective, you would need to take a single flight every single day for the next 274 years to reach 100,000 flights.
The above statements are based on 2015 to 2020 flight data from the Bureau of Transportation Statistics. We look at accidents, serious injuries, and fatalities per departure since the majority of recordable events take place upon take off or landing, and rarely mid-flight.
- From 2015 to 2020, there have been, on average: 0.34 accidents per 100,000 departures on a large commercial airplane.
- From 2015 to 2020, there have been, on average: 0.21 serious injuries per 100,000 departures on a large commercial airplane.
- From 2015 to 2020, there have been, on average: 0.01 fatalities per 100,000 departures on a large commercial airplane.
How Safe is Flying on a US Commuter Air Carrier
For Commuter Air Carrier services, the numbers are slightly higher. You would need to depart on approximately 95,000 flights before being in an accident and approximately 181,000 before being seriously injured or killed.
- From 2015 to 2020, there have been, on average: 1.05 accidents per 100,000 departures on commuter air carriers.
- From 2015 to 2020, there have been, on average: 0.55 accidents involving at least 1 serious injury per per 100,000 departures on commuter air carriers.
- From 2015 to 2020, there have been, on average: 0.55 fatalities per 100,000 departures on commuter air carriers.
What is defined as a Commuter Air Carrier?
According to the US Department of Transportation, as defined under section 298.2(e) it is an air carrier which:
- has a design capacity of 60 or fewer seats and
- carries passengers on at least 5 round-trip flights per week on at least one route between two or more points according to published flight schedules which specify the times, days of the week, and places between which they are performed.
These are typically smaller organizations that have several set routes to popular destinations. In the United States, JSX, Grant Aviation, and Boutique Air are examples of Commuter Air Carriers.
How Safe is Flying on a US On-Demand Air Taxi
For US on-demand air taxis, the frequency of fatalities is higher than US commercial airlines and similar to US commuter air carriers. You would need to depart on approximately 181,000 flights before being killed. Data related to accidents and serious injuries on on-demand air taxis is not available.
- From 2015 to 2020, there have been, on average: 0.55 fatalities per 100,000 departures on on-demand air taxis.
What is defined as an ‘air taxi’ ?
According to the US Department of Transportation, an air-taxi operator is defined as, “not a commuter air carrier, do not participate in interline agreements, and do not engage in foreign air transportation.”
For the purposes of sorting through NTSB data, these are categorized as “non-scheduled” flights. As in, these do not have regular routes that people may purchase a ticket on. Rather, these are chartered flights.
Is traveling by air safer than a car?
Traveling via a large commercial airline is by far safer than a car. Since many people also travel via truck (ex. Chevy Silverado), which can be above or below the 6,000lb specification, data for light and large trucks is also included below.
Between 2015 and 2020, for passenger cars, there were:
- 32,283,954 total crashes
- 8,831,566 total injuries
- 78,463 total fatalities
For the same time period, for light and large trucks, there were:
- 29,817,940 total crashes
- 5,701,599 total injuries
- 65,641 total fatalities
Between 2015 and 2020, amongst large commercial airlines, there were:
- 176 total accidents
- 111 total injuries
- 5 total fatalities
While the numbers show there were significantly less accidents, injuries, and fatalities for commercial airlines vs passenger cars or trucks, it’s difficult to make any conclusions because the pool of people that drive cars and trucks is significantly higher than those that fly. Therefore, we must look at some specific rates.
For cars and trucks combined:
- From 2015 to 2020, there have been, on average: 451.89 crashes per 100,000,000 vehicle miles
- From 2015 to 2020, there have been, on average: 107.24 injuries per 100,000,000 vehicle miles
- From 2015 to 2020, there have been, on average: 0.96 fatalities per 100,000,000 vehicle miles
This means that for all the cars and trucks on the road in the United States, when you add up the miles they each individually drive, there will be approximately 452 crashes, 107 injuries, and 1 fatality for every 100,000,000 miles driven.
The average person drives 15,000 miles a year so it will take him or her about 67 years to drive 1,000,000 miles. That means the average person will be in about 4.5 crashes, and experience 1 serious injury in his or her lifetime while driving.
If someone were to drive 100,000,000 miles in his or her lifetime, only then would the probability of dying drastically increase.
For large commercial airlines only (no commuter air carriers or air taxis)::
- From 2015 to 2020, there have been, on average: 0.34 accidents per 100,000 departures
- From 2015 to 2020, there have been, on average: 0.21 serious injuries per 100,000 departures
- From 2015 to 2020, there have been, on average: 0.01 fatalities per 100,000 departures
This means that for all departing flights in the United States, there are 34 accidents, 21 serious injuries, and 1 fatality for every 1,000,000 departures.
- From 2015 to 2020, there were a total of approximatley 51,421,140 large commercial airline departures in the United States
- From 2015, to 2020, there were a total of 176 non-fatal accidents, 111 injuries, and 5 total fatalities.
However, this doesn’t paint the full picture. Because of how regulated commercial flying is, we have access to data that also shows the following:
- Between 2011 and 2020, there were only 3 years (2013, 2018, 2019) where at least 1 fatality took place (14 total fatalities). For the other 7 years, there were 0 fatalities.
- Total annual accidents, injuries, and fatalities have all been on a downward trend since the early 2000’s.
References
+18 Sources
1. Dean, R. D., & Whitaker, K. M. (1982, July). Fear of Flying: Impact on the U.S. Air Travel Industry. Sage Journals. Retrieved December 12, 2022, from https://journals.sagepub.com/doi/abs/10.1177/004728758202100104
2. Karagianis, L. (2004). Air travel. MIT Spectrum. Retrieved December 15, 2022, from https://spectrum.mit.edu/winter-2004/air-travel/
3. National Transportation Safety Board. (n.d.). 2018 NTSB US Civil Aviation Accident Statistics. National Transportation and Safety Board. Retrieved December 12, 2022, from https://www.ntsb.gov/safety/data/Pages/AviationDataStats2018.aspx
4. United States Department of Transportation. (n.d.). Bus occupant safety data. Bureau of Transportation Statistics. Retrieved December 12, 2022, from https://www.bts.gov/content/bus-occupant-safety-dataa
5. United States Department of Transportation. (n.d.). Motorcycle rider safety data. Bureau of Transportation Statistics. Retrieved December 12, 2022, from https://www.bts.gov/content/motorcycle-rider-safety-data
6. United States Department of Transportation. (n.d.). Passenger car occupant safety data. Bureau of Transportation Statistics. Retrieved December 12, 2022, from https://www.bts.gov/content/passenger-car-occupant-safety-data
7. United States Department of Transportation. (n.d.). Railroad passenger safety data. Bureau of Transportation Statistics. Retrieved December 12, 2022, from https://www.bts.gov/content/railroad-passenger-safety-data
8. United States Department of Transportation. (n.d.). Transportation fatalities by mode. Bureau of Transportation Statistics. Retrieved December 12, 2022, from https://www.bts.gov/content/transportation-fatalities-mode
9. United States Department of Transportation. (n.d.). Truck occupant safety data. Bureau of Transportation Statistics. Retrieved December 12, 2022, from https://www.bts.gov/content/truck-occupant-safety-data
10. United States Department of Transportation. (n.d.). U.S. air carrier safety data. Bureau of Transportation Statistics. Retrieved December 12, 2022, from https://www.bts.gov/content/us-air-carrier-safety-data
11. United States Department of Transportation. (n.d.). U.S. commuter air carrier safety data. Bureau of Transportation Statistics. Retrieved December 12, 2022, from https://www.bts.gov/content/us-commuter-air-carrier-safety-data
12. United States Department of Transportation. (n.d.). U.S. general aviation safety data. Bureau of Transportation Statistics. Retrieved December 12, 2022, from https://www.bts.gov/content/us-general-aviationa-safety-data
13. United States Department of Transportation. (n.d.). U.S. on-demand air taxi safety data. Bureau of Transportation Statistics. Retrieved December 12, 2022, from https://www.bts.gov/content/us-demand-air-taxia-safety-data
14. National Transportation Safety Board. (2015, February 3). DCA13MA120.aspx. NTSB – National Transportation Safety Board. https://www.ntsb.gov/investigations/Pages/DCA13MA120.aspx
15. Bureau of Transportation Statistics. (n.d.). Data Elements. BTS – Bureau of Transportation Statistics. Retrieved November 24, 2023, from https://www.transtats.bts.gov/Data_Elements.aspx?Data=1
16. The Associated Press. (2023, July 19). How hard is it to win the lottery? Odds to keep in mind as Powerball and Mega Millions jackpots soar. AP News. https://apnews.com/article/powerball-mega-millions-winning-odds-numbers-a3e5a8e8e7ed15d7500c1d6acdab6785
17. New York State. (n.d.). Heart Disease and Stroke Prevention. New York Department of Health. Retrieved November 24, 2023, from https://www.health.ny.gov/diseases/cardiovascular/heart_disease/
18. Insurance Institute for High Safety. (2023, May 23). Fatality Facts 2021: Yearly snapshot. IIHS-HLDI Crash Testing and Highway Safety. https://www.iihs.org/topics/fatality-statistics/detail/yearly-snapshot